
OLR technology
The ONLINE RHEOMETER® (OLR) Technology Platform
The ONLINE RHEOMETER® (OLR) technology platform utilises small-amplitude oscillatory squeeze flow to characterise the viscoelastic properties of process liquids. The scientific principles underlying this technique are well established in the literature [1–3].
The OLR platform applies this methodology to measure the viscoelastic response of a material across a range of frequencies (typically 1 ≤ f ≤ 100 Hz), providing separate quantification of both elastic and viscous behaviour. From the measured storage modulus (G’), representing the material’s solid-like response, and loss modulus (G’’), representing its liquid-like behaviour, the complex viscosity (|η*|) can be calculated. The platform reports the frequency-dependent variation of |η*| in a standard |η*| versus frequency (f) plot.
Figure 1 shows a general assembly of the OLR (Series 1000 shown as an example) and the position of the end plate within the flow cell. At the beginning of each measurement cycle, the top plate moves to a predetermined gap between itself and the stationary bottom plate, trapping a sample of liquid between them.
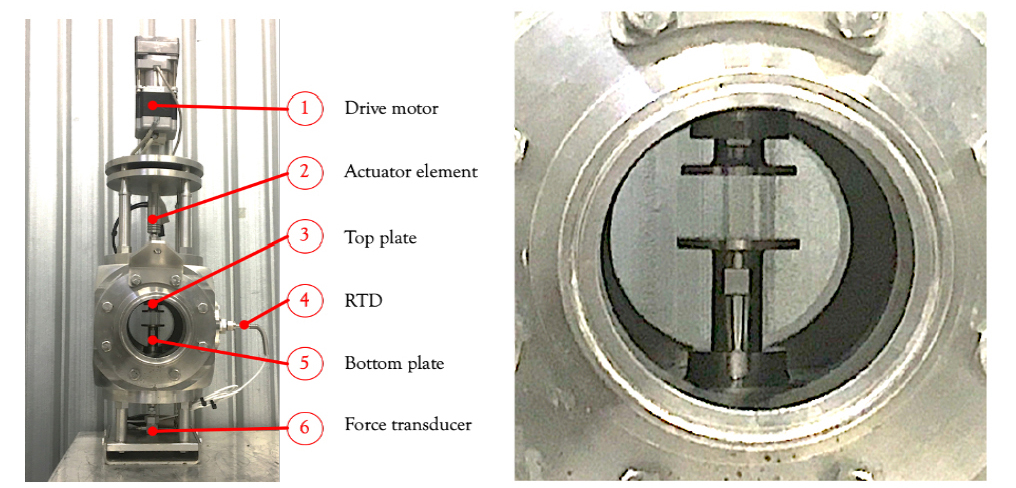
Figure 1. Top panel shows the general assembly of the OLR and
an image of the flow-cell with the position of the measuring plates.
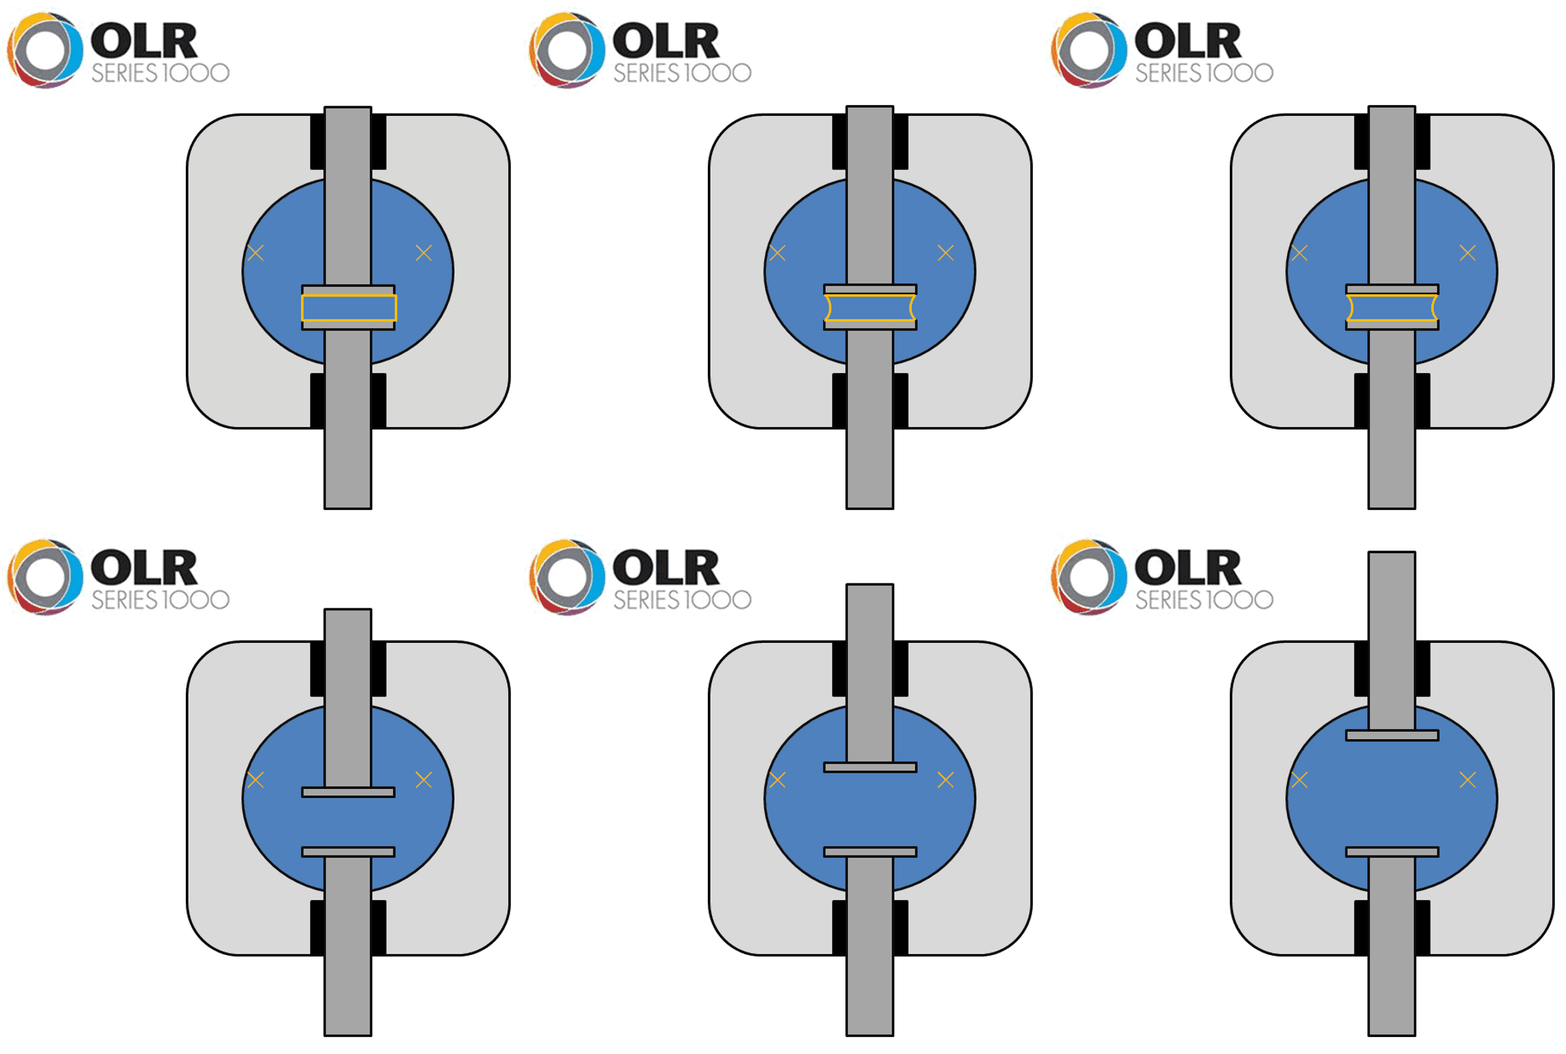
Figure 2. (Above) Animation of the measuring cycle.
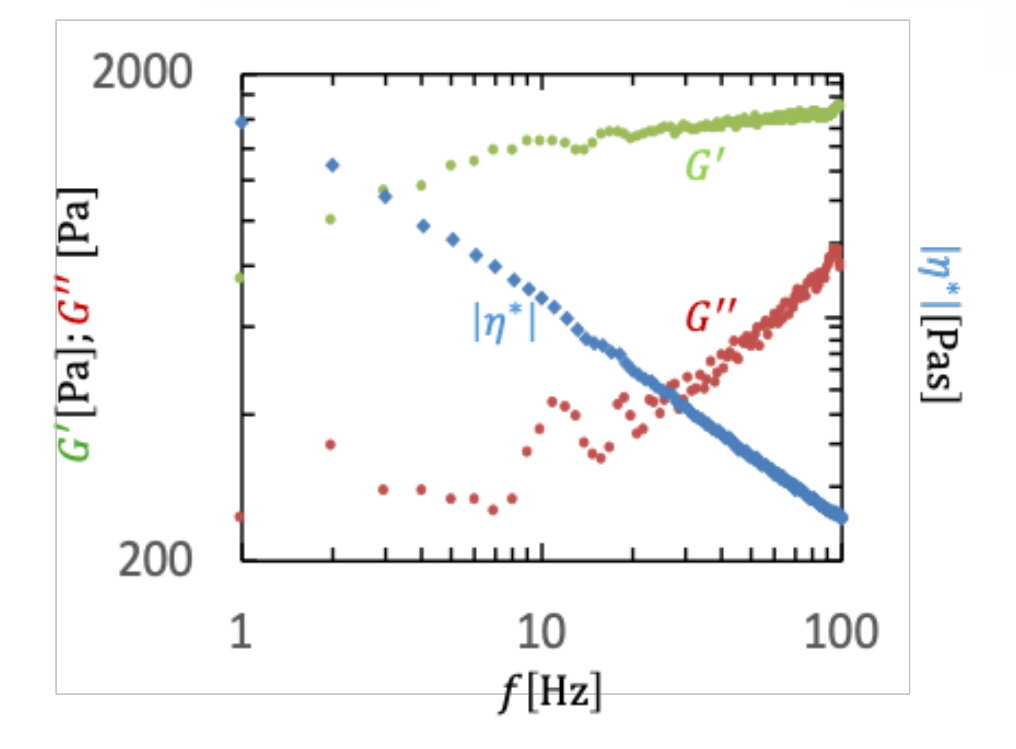
Figure 3. (Above) A typical output from the Online Rheometer, showing the Storage Modulus G’(green), the Loss modulus G’’ (red) and the complex viscosity |h*| (blue) as a function of frequency (f)
A piezoelectric actuator attached to the top plate applies oscillatory motion over a range of frequencies, while a load cell (force transducer) on the bottom plate records the resulting force. From the imposed deformation and the recorded force response, the frequency-dependent material parameters are determined.
Once the measurement cycle is complete, the top plate retracts, the flow renews the sample, and the cycle repeats. The animation in Figure 2 illustrates this operating sequence. The crosses in the image indicate that the flow direction is into the plane of the figure. Each measurement cycle typically takes about two minutes and yields a complete set of viscoelastic parameters. The interval between cycles can be adjusted as required. Figure 3 shows a typical output.
The OLR outputs have been validated [3] against a range of established techniques using pipe-loop testing. Figure 4 presents a schematic of the pipe-loop configuration, with details of the instrumentation and materials used. An image of the experimental setup is also shown in the bottom panel of the figure. Figure 5 displays the results of these experiments, demonstrating that the OLR measurements agree well with both laboratory and pressure-drop data. Moreover, the OLR extends the measurable frequency and shear-rate range beyond those accessible to laboratory or pressure-drop methods, which are typically limited by instrument inertia or the onset of turbulence in flow.
Figure 4. (Right) A schematic of the pipe-loop configuration, with details of the instrumentation and materials used. An image of the experimental setup is also shown.
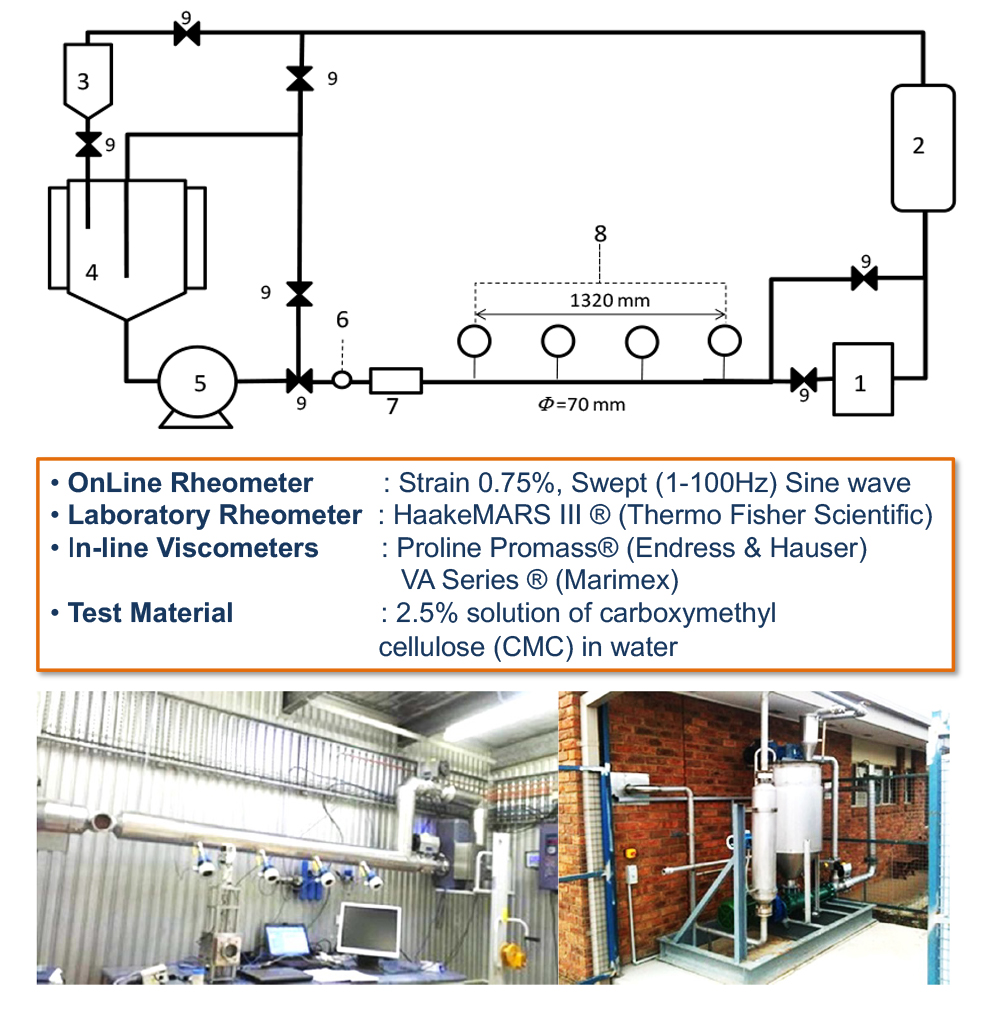
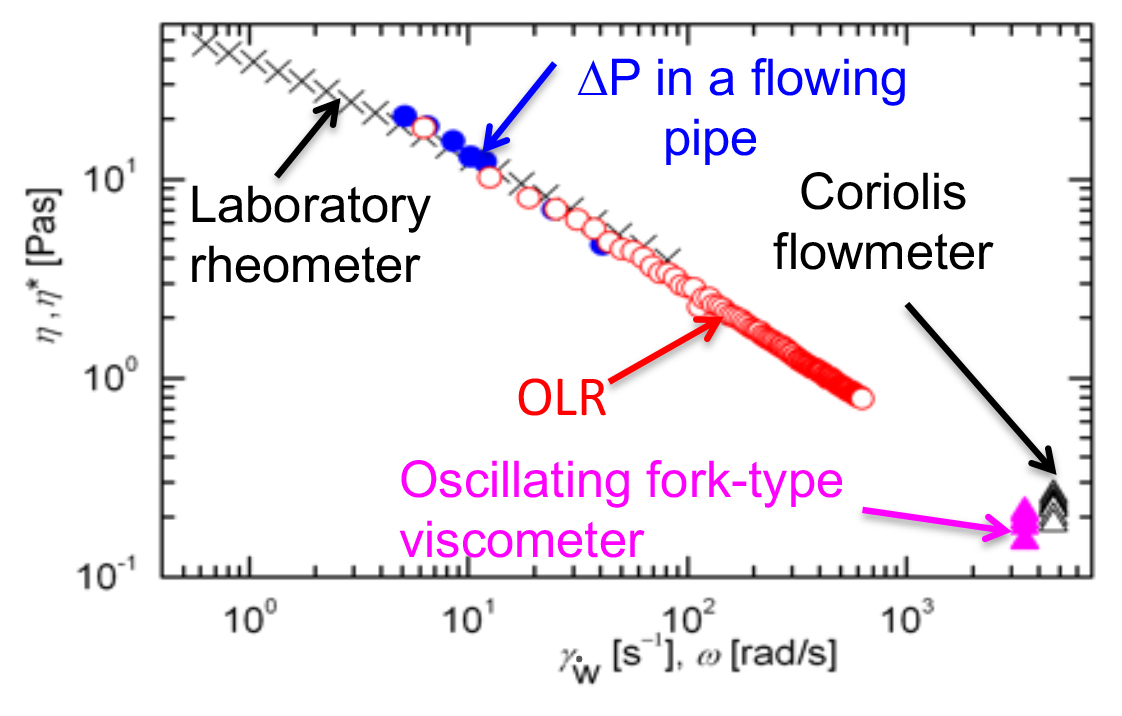
Figure 5. (Left) Comparison between the OLR measurements and measurements made by laboratory rheometer (crosses) after manual sampling, Pressure drop measurements (after changing of flow rates), Coriolis technique and Oscillating fork technique. The latter strategies are most employed in industrial quality and process control.
References
- Bell, D., Binding, D.M. and Walters, K., 2006. The oscillatory squeeze flow rheometer: comprehensive theory and a new experimental facility. Rheologica acta, 46(1), pp.111-121
- Field, J.S., Swain, M.V. and Phan-Thien, N., 1996. An experimental investigation of the use of random squeezing to determine the complex modulus of viscoelastic fluids. Journal of non-newtonian fluid mechanics, 65(2-3), pp.177-194.
- Konigsberg, D., Nicholson, T.M., Halley, P.J., Kealy, T.J. and Bhattacharjee, P.K., 2013. Online process rheometry using oscillatory squeeze flow. Applied Rheology, 23(3), p.35688.